Git is a piece of version control software written by Linus Torvalds, the creator of the Linux operating system. It essentially tracks changes to local files.
Let’s say that you’re working on a project that examines Nigeria’s vital statistics. You’ve created a project folder called ‘vital_statistics’ with the following files and sub-folders.
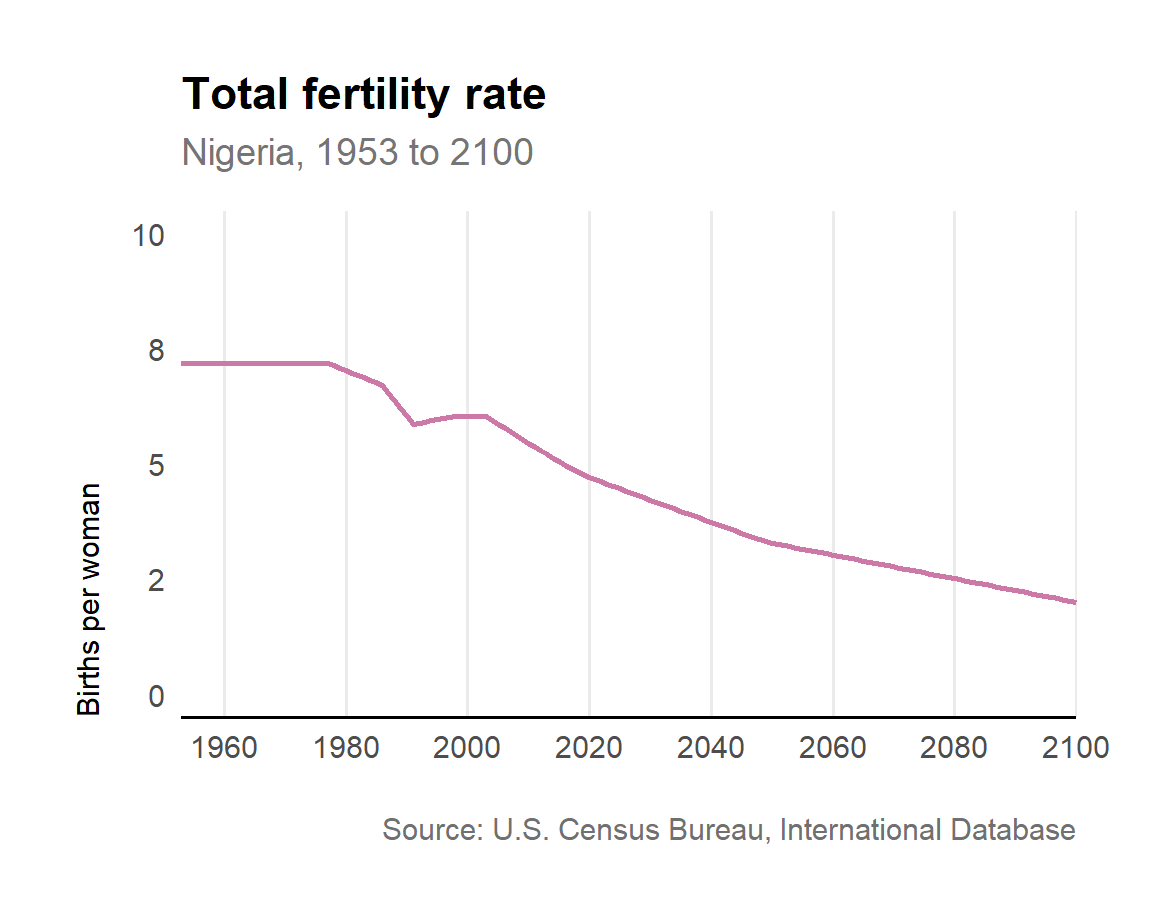
You have three sub-folders: The ‘data’ folder contains a CSV file of Nigeria’s total fertility rates (fertility_rate.csv) from the US Census Bureau’s International Database. The ‘scripts’ folder contains R code (fertility_rate.R) that has created the line plot (fertility_rate.jpeg) in the ‘outputs’ folder.
Figure 9.1: Line chart showing Nigeria’s total fertility rate
However, you’ve been told to compare Nigeria’s fertility rate with Rwanda’s. This is where git comes in. Rather than creating a new file or overwriting it you can just track your file changes with Git.
Navigate to the Terminal tab in the Console pane of RStudio. You can also use the Command Prompt or PowerShell in Windows or the Terminal on a Mac.
Go to the project folder containing your code and data: cd /path/to/your/project/folder
Initialise the folder as a git repository or repo: git init.
Check which folders / files are currently untracked: git status
$ git statusOn branch masterNo commits yetUntracked files:(use"git add <file>..." to include in what will be committed)data/outputs/scripts/nothing added to commit but untracked files present (use"git add" to track)
We have three folders that are currently untracked.
Put the folders / files in the staging area: git add -A. This tracks all of the folders / files in the repo. You can also track individual files by specifying them within the Git command: git add fertility_rate.R
Then take a snapshot with git commit
Git commit messages
It is good practice to add a descriptive message to each commit. For example, we might add git commit -m"Line chart showing Nigeria's total fertility rate". When we look back through the history of our commits we can then see at a glance what changes we made to the code. There are various dos and don’ts about good commit messages but the ONS Data Science Campus has some useful advice in their style guide for version control.
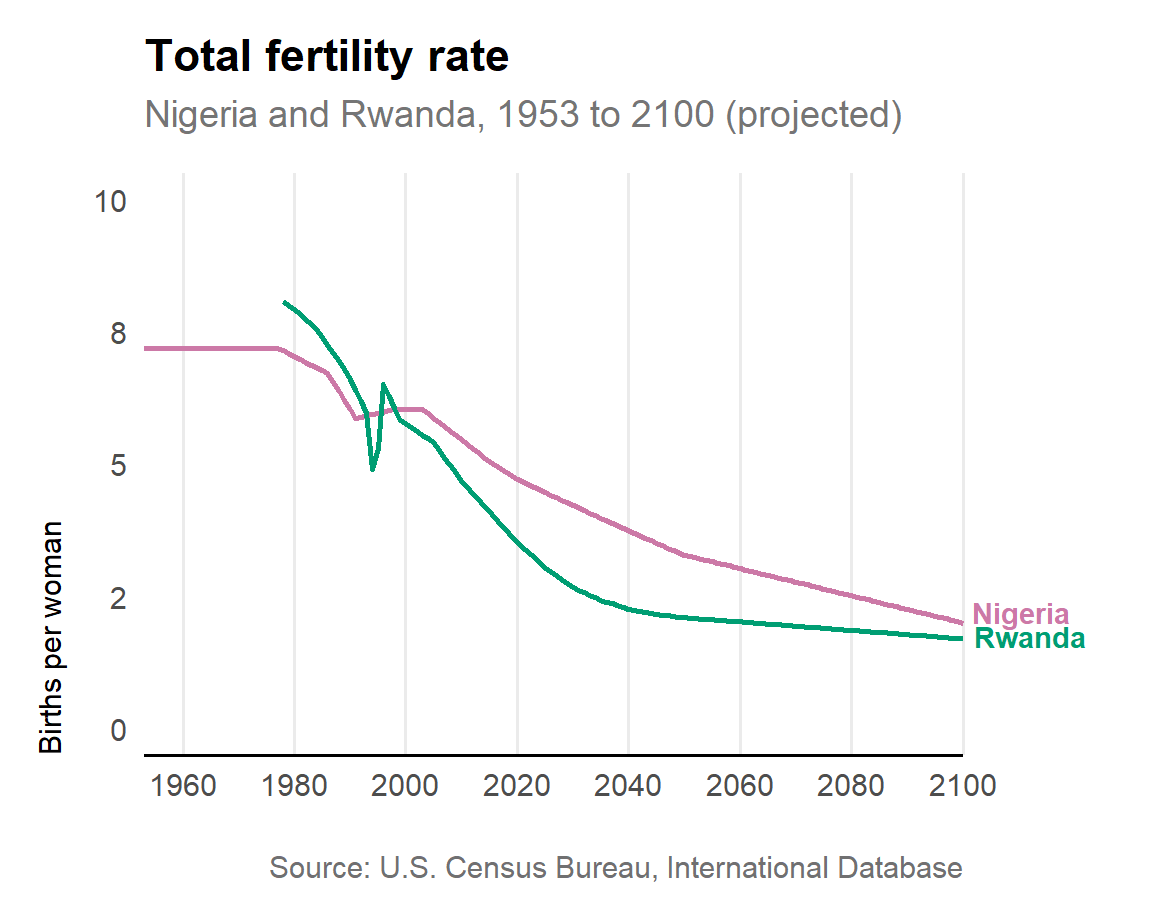
Then we can update our R code so that we can compare the historic and projected trend in fertility rates between Nigeria and Rwanda.
Figure 9.2: Multiple line chart of total fertility rate in Nigeria and Rwanda
To track these changes we’d follow these steps.
Check that you have file changes: git status
$ git statusOn branch masterChanges not staged for commit:(use"git add <file>..." to update what will be committed)(use"git restore <file>..." to discard changes in working directory)modified: data/fertility_rate.csvmodified: outputs/fertility_rate.jpegmodified: scripts/fertility_rate.Rno changes added to commit (use"git add" and/or "git commit -a")
We have updated our dataset with values for Rwanda (fertility_rate.csv), created a new plot (fertility_rate.jpeg) and revised our R script (fertility_rate.R).
Put the changes in the staging area: git add -A
Commit the changes: git commit -m"Multiple line chart of total fertility rate in Nigeria and Rwanda"
Check that everything has been committed: git status
.gitignore
A .gitignore is a text file that lists all of the files and folders that you don’t want tracked by Git. For example, this list could include datasets that contain sensitive data. Listing files to .gitignore is especially important if you intend to host files on GitHub. To create a .gitignore file just enter touch .gitignore into the terminal. You can either edit the file in the terminal or in a text editor. If you want to add a file using the terminal you can enter echo FILENAME >> .gitignore.
Rather than overwriting your file with different file names you now have a linear history of commits for the same file. To visualise the history of your commits you can type git log --reverse --pretty=format:'| %H | %s |' into the Terminal. This prints out the commit hash, a unique identifier for each commit, alongside the commit messages.
$ git log --reverse--pretty=format:'| %H | %s |'|c5dfa1b7c8da5a1b3ecb026c20afd953e3a9d923|Line chart showing Nigeria's total fertility rate || 36b4a9069528cbeac215ded0bf197c4b60445e96 | Multiple line chart of total fertility rate in Nigeria and Rwanda |
That is the basic workflow for using Git to track your local files.
The glossary below lists some of the most common terms and Git commands.
Common terms and Git commands
repo
project folder
remote
a repo available to all team members
clone
get repo from remote
stage
prepare files for commit
commit
take a snapshot of a file or files
hash
commit id
pull
get commits from a repo
push
send commits to a repo
branch
sandbox in a repo
main
default branch where live code sits
merge
combine all commits on branches
merge conflict
conflict contradictory file changes
pull
request propose changes to remote repo
9.2 GitHub
GitHub is a website and service that hosts Git repositories, where developers can store, share, and collaborate on their projects.
Let’s say that a colleague wants to collaborate with you on your vital statistics project. The first step is to create a remote repo on GitHub to push your local files to.
Create a new repo called vital_statistics. There is no need to add a README file, licence or a .gitignore file at this stage. Click through to ‘Create repository’.
README
A README provides information about the purpose and contents of a GitHub repo. For example, the README for the vsreport package provides an overview, guidance on installation, some example code, and a list of contributors. Each README file is written using Markdown, a simple formatting syntax for plain text documents that can be easily converted into HTML. A good tutorial on writing in Markdown can be found on the GitHub website.
Navigate to ‘Quick setup — if you’ve done this kind of thing before’ on the subsequent page and copy the remote repository URL. It will something look like https://github.com/USERNAME/vital_statistics.git
Next, open the terminal and ensure that it is pointing to the current folder. To print the name of the current folder just enter pwd
Now enter git remote add origin REMOTE-URL into the terminal replacing REMOTE-URL with the remote repository URL from step 2.
To check that the correct URL has been set enter git remote -v
Then push the changes you have made to your local repo to GitHub enter git push origin master You should now see all your code and subfolders on GitHub.
Branches
If you are collaborating with others it is generally a good idea to create what’s called a branch. This is essentially a sandbox for rough workings out. The working code is on the ‘main’ branch but the draft, experimental code is held on a separate branch.
These are the steps that you might follow:
Create a branch: git branch development
Switch to the development branch: git checkout development
Push changes to the remote branch: git push origin development
If you are a collaborator on this project and want to copy or fork the GitHub repository for you to work on locally you can follow these steps.
Set you working folder e.g. cd /path/to/your/folder
Clone the remote repo in the current directory by entering git clone https://github.com/USERNAME/vital_statistics.git This is the same remote repository URL that we used earlier.
Source Code
---title: Git and GitHubformat: html: code-fold: true code-tools: trueeditor: source---```{r setup, include=FALSE}knitr::opts_chunk$set(echo =FALSE, message =FALSE, warning =FALSE, fig.width =6, fig.align ="left", fig.asp =0.8, out.width ="70%")```## Git[Git](https://git-scm.com/) is a piece of version control software written by Linus Torvalds, the creator of the Linux operating system. It essentially tracks changes to local files.Let's say that you're working on a project that examines Nigeria's vital statistics. You've created a project folder called 'vital_statistics' with the following files and sub-folders.```vital_statistics ├── data ├── fertility_rate.csv ├── scripts |── fertility_rate.R ├── outputs |── fertility_rate.jpeg```You have three sub-folders: The 'data' folder contains a CSV file of Nigeria's total fertility rates (`fertility_rate.csv`) from the [US Census Bureau’s International Database](https://www.census.gov/data-tools/demo/idb/#/dashboard?YR_ANIM=2021&COUNTRY_YEAR=2024&COUNTRY_YR_ANIM=2024&CCODE_SINGLE=NG&CCODE=NG). The 'scripts' folder contains R code (`fertility_rate.R`) that has created the line plot (`fertility_rate.jpeg`) in the 'outputs' folder. The R code and resulting plot are shown below.```{r, echo=TRUE, eval=FALSE}library(tidyverse) ; library(ggtext)df <-read_csv("../data/fertility_rate.csv") |>mutate(year =ymd(year, truncated = 2L))ggplot(df, aes(x = year, y = value)) +geom_line(colour ="#CC79A7", linewidth =1) +scale_x_date(expand =expansion(),breaks =seq.Date(as.Date("1960-01-01"), as.Date("2100-01-01"), by ="20 years"),date_labels ="%Y") +scale_y_continuous(limits =c(0,10),labels = scales::label_number(accuracy =1, scale_cut = scales::cut_short_scale())) +labs(x =NULL, y ="Births per woman",title ="Total fertility rate",subtitle ="<span style = 'color:#757575;'>Nigeria, 1953 to 2100</span>",caption ="Source: U.S. Census Bureau, International Database") +theme_minimal(base_size =14) +theme(plot.margin =unit(rep(1, 4), "cm"),panel.grid.major.y =element_blank(),panel.grid.minor =element_blank(),axis.line.x =element_line(colour ="#000000"),plot.title =element_text(size =rel(1.2), face ="bold"),plot.subtitle =element_markdown(margin =margin(b =15)),plot.caption =element_text(size =rel(0.8), colour ="#707071", margin =margin(t =20)),axis.title.y =element_text(size =rel(0.8), hjust =0, margin =margin(r =10)) ) ggsave("../outputs/fertility_rate.jpeg", dpi =300, scale =1)``````{r}#| label: fig-line-plot#| fig-cap: "Line chart showing Nigeria's total fertility rate"library(tidyverse) ; library(ggtext)df <-read_csv("data/fertility_rate.csv") |>filter(name =="Nigeria") |>mutate(year =ymd(year, truncated = 2L))ggplot(df, aes(x = year, y = value)) +geom_line(colour ="#CC79A7", linewidth =1) +scale_x_date(expand =expansion(),breaks =seq.Date(as.Date("1960-01-01"), as.Date("2100-01-01"), by ="20 years"),date_labels ="%Y") +scale_y_continuous(limits =c(0,10),labels = scales::label_number(accuracy =1, scale_cut = scales::cut_short_scale())) +labs(x =NULL, y ="Births per woman",title ="Total fertility rate",subtitle ="<span style = 'color:#757575;'>Nigeria, 1953 to 2100</span>",caption ="Source: U.S. Census Bureau, International Database") +theme_minimal(base_size =14) +theme(plot.margin =unit(rep(1, 4), "cm"),panel.grid.major.y =element_blank(),panel.grid.minor =element_blank(),axis.line.x =element_line(colour ="#000000"),plot.title =element_text(size =rel(1.2), face ="bold"),plot.subtitle =element_markdown(margin =margin(b =15)),plot.caption =element_text(size =rel(0.8), colour ="#707071", margin =margin(t =20)),axis.title.y =element_text(size =rel(0.8), hjust =0, margin =margin(r =10)) )```However, you've been told to compare Nigeria's fertility rate with Rwanda's. This is where git comes in. Rather than creating a new file or overwriting it you can just track your file changes with Git.1. Navigate to the Terminal tab in the Console pane of RStudio. You can also use the Command Prompt or PowerShell in Windows or the Terminal on a Mac.2. Go to the project folder containing your code and data: `cd /path/to/your/project/folder`{.bash}3. Initialise the folder as a git repository or **repo**: `git init`{.bash}.4. Check which folders / files are currently untracked: `git status`{.bash}```sh$ git statusOn branch masterNo commits yetUntracked files:(use"git add <file>..." to include in what will be committed)data/outputs/scripts/nothing added to commit but untracked files present (use"git add" to track)```We have three folders that are currently untracked.5. Put the folders / files in the staging area: `git add -A`{.bash}. This tracks all of the folders / files in the repo. You can also track individual files by specifying them within the Git command: `git add fertility_rate.R`{.bash}6. Then take a snapshot with `git commit`{.bash}::: {.callout-tip}## Git commit messagesIt is good practice to add a descriptive message to each commit. For example, we might add `git commit -m "Line chart showing Nigeria's total fertility rate"`{.bash}. When we look back through the history of our commits we can then see at a glance what changes we made to the code. There are various dos and don'ts about good commit messages but the ONS Data Science Campus has some useful advice in their [style guide for version control](https://datasciencecampus.github.io/coding-standards/version-control.html#commit-message).:::Then we can update our R code so that we can compare the historic and projected trend in fertility rates between Nigeria and Rwanda.```{r, echo=TRUE, eval=FALSE}library(tidyverse) ; library(ggtext)df <-read_csv("../data/fertility_rate.csv") |>mutate(year =ymd(year, truncated = 2L),position =if_else(name =="Nigeria", 0, 0.4))ggplot(df, aes(x = year, y = value)) +geom_line(aes(colour = name), linewidth =1, show.legend =FALSE) +geom_text(data =filter(df, year ==max(year)),aes(label = name, colour = name, vjust = position),hjust =-0.1, fontface ="bold",show.legend =FALSE) +scale_colour_manual(values =c("Nigeria"="#CC79A7", "Rwanda"="#009E73")) +scale_x_date(expand =expansion(),breaks =seq.Date(as.Date("1960-01-01"), as.Date("2100-01-01"), by ="20 years"),date_labels ="%Y") +scale_y_continuous(limits =c(0,10),labels = scales::label_number(accuracy =1, scale_cut = scales::cut_short_scale())) +labs(x =NULL, y ="Births per woman",title ="Total fertility rate",subtitle ="<span style = 'color:#757575;'>Nigeria and Rwanda, 1953 to 2100 (projected)</span>",caption ="Source: U.S. Census Bureau, International Database") +theme_minimal(base_size =14) +theme(plot.margin =margin(0.5,2.5,0.5,0.5,"cm"),panel.grid.major.y =element_blank(),panel.grid.minor =element_blank(),axis.line.x =element_line(colour ="#000000"),plot.title =element_text(size =rel(1.2), face ="bold"),plot.subtitle =element_markdown(margin =margin(b =15)),plot.caption =element_text(size =rel(0.8), colour ="#707071", margin =margin(t =20)),axis.title.y =element_text(size =rel(0.8), hjust =0, margin =margin(r =10)) ) +coord_cartesian(clip ="off")ggsave("../outputs/fertility_rate.jpeg", dpi =300, scale =1)``````{r}#| label: fig-multiple-line-plot#| fig-cap: "Multiple line chart of total fertility rate in Nigeria and Rwanda"library(tidyverse) ; library(ggtext)df <-read_csv("data/fertility_rate.csv") |>mutate(year =ymd(year, truncated = 2L),position =if_else(name =="Nigeria", 0, 0.4))ggplot(df, aes(x = year, y = value)) +geom_line(aes(colour = name), linewidth =1, show.legend =FALSE) +geom_text(data =filter(df, year ==max(year)),aes(label = name, colour = name, vjust = position),hjust =-0.1, fontface ="bold",show.legend =FALSE) +scale_colour_manual(values =c("Nigeria"="#CC79A7", "Rwanda"="#009E73")) +scale_x_date(expand =expansion(),breaks =seq.Date(as.Date("1960-01-01"), as.Date("2100-01-01"), by ="20 years"),date_labels ="%Y") +scale_y_continuous(limits =c(0,10),labels = scales::label_number(accuracy =1, scale_cut = scales::cut_short_scale())) +labs(x =NULL, y ="Births per woman",title ="Total fertility rate",subtitle ="<span style = 'color:#757575;'>Nigeria and Rwanda, 1953 to 2100 (projected)</span>",caption ="Source: U.S. Census Bureau, International Database") +theme_minimal(base_size =14) +theme(plot.margin =margin(0.5,2.5,0.5,0.5,"cm"),panel.grid.major.y =element_blank(),panel.grid.minor =element_blank(),axis.line.x =element_line(colour ="#000000"),plot.title =element_text(size =rel(1.2), face ="bold"),plot.subtitle =element_markdown(margin =margin(b =15)),plot.caption =element_text(size =rel(0.8), colour ="#707071", margin =margin(t =20)),axis.title.y =element_text(size =rel(0.8), hjust =0, margin =margin(r =10)) ) +coord_cartesian(clip ="off")```To track these changes we'd follow these steps.1. Check that you have file changes: `git status`{.bash}```sh$ git statusOn branch masterChanges not staged for commit:(use"git add <file>..." to update what will be committed)(use"git restore <file>..." to discard changes in working directory)modified: data/fertility_rate.csvmodified: outputs/fertility_rate.jpegmodified: scripts/fertility_rate.Rno changes added to commit (use"git add" and/or "git commit -a")```We have updated our dataset with values for Rwanda (`fertility_rate.csv`), created a new plot (`fertility_rate.jpeg`) and revised our R script (`fertility_rate.R`).2. Put the changes in the staging area: `git add -A`{.bash}3. Commit the changes: `git commit -m "Multiple line chart of total fertility rate in Nigeria and Rwanda"`{.bash}4. Check that everything has been committed: `git status`{.bash}::: {.callout-note}## `.gitignore`A `.gitignore` is a text file that lists all of the files and folders that you don't want tracked by Git. For example, this list could include datasets that contain sensitive data. Listing files to `.gitignore` is especially important if you intend to host files on GitHub. To create a `.gitignore` file just enter `touch .gitignore`{.bash} into the terminal. You can either edit the file in the terminal or in a text editor. If you want to add a file using the terminal you can enter `echo FILENAME >> .gitignore`{.bash}.:::Rather than overwriting your file with different file names you now have a linear history of commits for the same file. To visualise the history of your commits you can type `git log --reverse --pretty=format:'| %H | %s |'` into the Terminal. This prints out the commit **hash**, a unique identifier for each commit, alongside the commit messages.```sh$ git log --reverse--pretty=format:'| %H | %s |'|c5dfa1b7c8da5a1b3ecb026c20afd953e3a9d923|Line chart showing Nigeria's total fertility rate || 36b4a9069528cbeac215ded0bf197c4b60445e96 | Multiple line chart of total fertility rate in Nigeria and Rwanda |```That is the basic workflow for using Git to track your local files.The glossary below lists some of the most common terms and Git commands.| | ||--------------------|:----------------------------------------|| **repo** | project folder || **remote** | a repo available to all team members || **clone** | get repo from remote || **stage** | prepare files for commit || **commit** | take a snapshot of a file or files || **hash** | commit id || **pull** | get commits from a repo || **push** | send commits to a repo || **branch** | sandbox in a repo || **main** | default branch where live code sits || **merge** | combine all commits on branches || **merge conflict** | conflict contradictory file changes || **pull** | request propose changes to remote repo |: Common terms and Git commands {.hover tbl-colwidths="[20,80]"}## GitHub[GitHub](https://github.com/) is a website and service that hosts Git repositories, where developers can store, share, and collaborate on their projects.Let's say that a colleague wants to collaborate with you on your vital statistics project. The first step is to create a **remote** repo on GitHub to **push** your local files to.1. Create a new [**repo**](https://github.com/new)called`vital_statistics`. There is no need to add a README file, licence or a `.gitignore` file at this stage. Click through to 'Create repository'.::: {.callout-note}## READMEA README provides information about the purpose and contents of a GitHub repo. For example, the README for the [vsreport](https://github.com/tech-acs/vsreport)package provides an overview, guidance on installation, some example code, and a list of contributors. Each README file is written using [Markdown](https://daringfireball.net/projects/markdown/), a simple formatting syntax for plain text documents that can be easily converted into HTML. A good [tutorial](https://docs.github.com/en/get-started/writing-on-github/getting-started-with-writing-and-formatting-on-github/basic-writing-and-formatting-syntax)on writing in Markdown can be found on the GitHub website.:::2. Navigate to '**Quick setup — if you’ve done this kind of thing before**' on the subsequent page and copy the remote repository URL. It will something look like `https://github.com/USERNAME/vital_statistics.git`3. Next, open the terminal and ensure that it is pointing to the current folder. To print the name of the current folder just enter `pwd`{.bash}4. Now enter `git remote add origin REMOTE-URL`{.bash} into the terminal replacing `REMOTE-URL` with the remote repository URL from step 2.5. To check that the correct URL has been set enter `git remote -v`{.bash}6. Then push the changes you have made to your local repo to GitHub enter `git push origin master`{.bash} You should now see all your code and subfolders on GitHub.::: {.callout-tip}## BranchesIf you are collaborating with others it is generally a good idea to create what's called a **branch**. This is essentially a sandbox for rough workings out. The working code is on the 'main' branch but the draft, experimental code is held on a separate branch.These are the steps that you might follow:1. Create a branch: `git branch development`{.bash}2. Switch to the development branch: `git checkout development`{.bash}3. Push changes to the remote branch: `git push origin development`{.bash}:::If you are a collaborator on this project and want to copy or **fork** the GitHub repository for you to work on locally you can follow these steps.1. Set you working folder e.g. `cd /path/to/your/folder`{.bash}2. **Clone** the remote repo in the current directory by entering `git clone https://github.com/USERNAME/vital_statistics.git`{.bash} This is the same remote repository URL that we used earlier.