Core concepts
This page introduces the key architectural concepts that make up the Dashboard Starter Kit. Understanding these will help you navigate the rest of the documentation.
Dual-Database Architecture
The kit operates with two database tiers:
- PostgreSQL (Main App) — Stores users, roles, permissions, settings, area hierarchies, artefact metadata, and cached data. Uses PostGIS for spatial queries and the
ltreeextension for hierarchical area lookups. - MySQL / MariaDB (Breakout DB / Data Sources) — Stores the actual survey or census data, "broken out" from CSPro into relational tables. Multiple data sources can be connected simultaneously.
The BreakoutQueryBuilder
The BreakoutQueryBuilder is the data access layer that bridges these two worlds. It automates CSPro table joins, handles soft-delete and partial-save filtering, and enriches query results with geographic area metadata — ensuring areas with zero data still appear in reports.
Query Fragments
Query Fragments serve as the geographic routing engine. They translate the user's currently selected area filter into the correct SQL SELECT and WHERE clauses, enabling automatic drill-down through the hierarchy levels.
Artefact Types
The kit provides six artefact types for building dashboards:
| Type | Description |
|---|---|
| Summary Cards | High-level status on the home page (case counts, dates) |
| Indicators | Plotly.js charts with metadata, scoped to pages or area insights |
| Map Indicators | Choropleth maps with color-coded bins and tooltips |
| Gauges | Single-value progress indicators with color thresholds |
| Reports | Tabular CSV/Excel exports with scheduling and email delivery |
| Area Insights | Dynamic drill-down page combining gauges, scorecards, and charts |
MCP Server
The kit includes a Model Context Protocol (MCP) server that enables AI assistants to create and manage artefacts programmatically. It exposes 15 tools (create, read, edit, validate) and 4 documentation resources.
Three-Path Artefact Creation
Every artefact type supports three creation paths sharing the same validation and Action logic:
| Path | Entry Point |
|---|---|
| CLI | php artisan chimera:make-{type} (interactive prompts) |
| Web | Management UI form with templates and sample code |
| MCP | AI-driven tool calls via the MCP server |
Data sources
What we usually refer to as a data source in the context of this app is the database, which usually originates from a census or survey questionnaire. In case of CSPro, each CAPI app or questionnaire will have its own database where the interviews (cases) received from the field are stored.
We also use the data source concept to store other related metadata such as the exercise start and end dates, exercise name etc. It is a crucial and core concept in our dashboard implementation. It is also sometimes referred to as a questionnaire. In general, please consider data source and questionnaire as interchangeable terms.

Summary cards
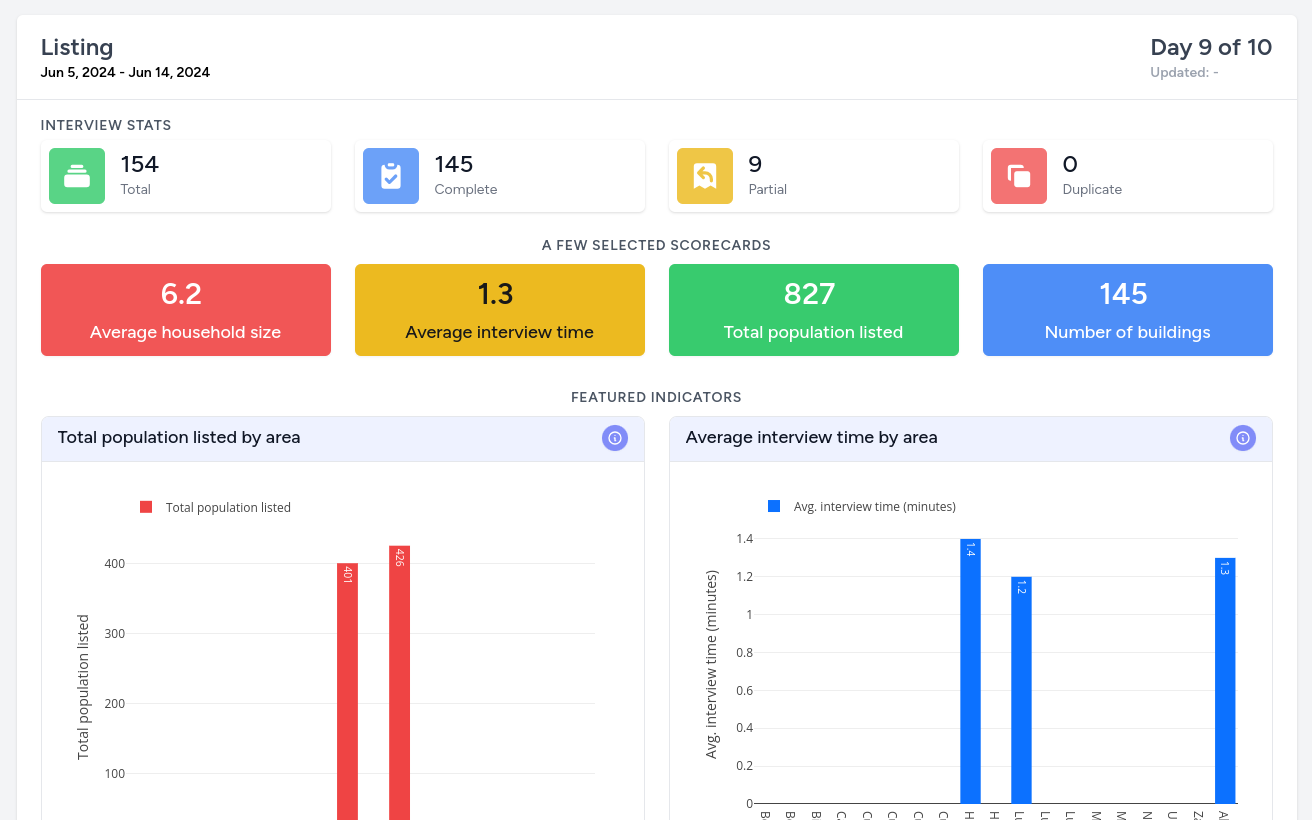
Summary cards are what we use to display the high level status of a data source or field data collection exercise (census/survey). They are displayed on the home page and show various high level stats such as total number of interviews collected, the exercise start and end dates etc.
Each summary card can also contain various scorecards that display stats from within the data itself, and you can have multiple summary cards on the home page.
The summary cards can also contain featured indicators. These are normal indicators that have been selected to be displayed here because of their perceived importance.
Indicators
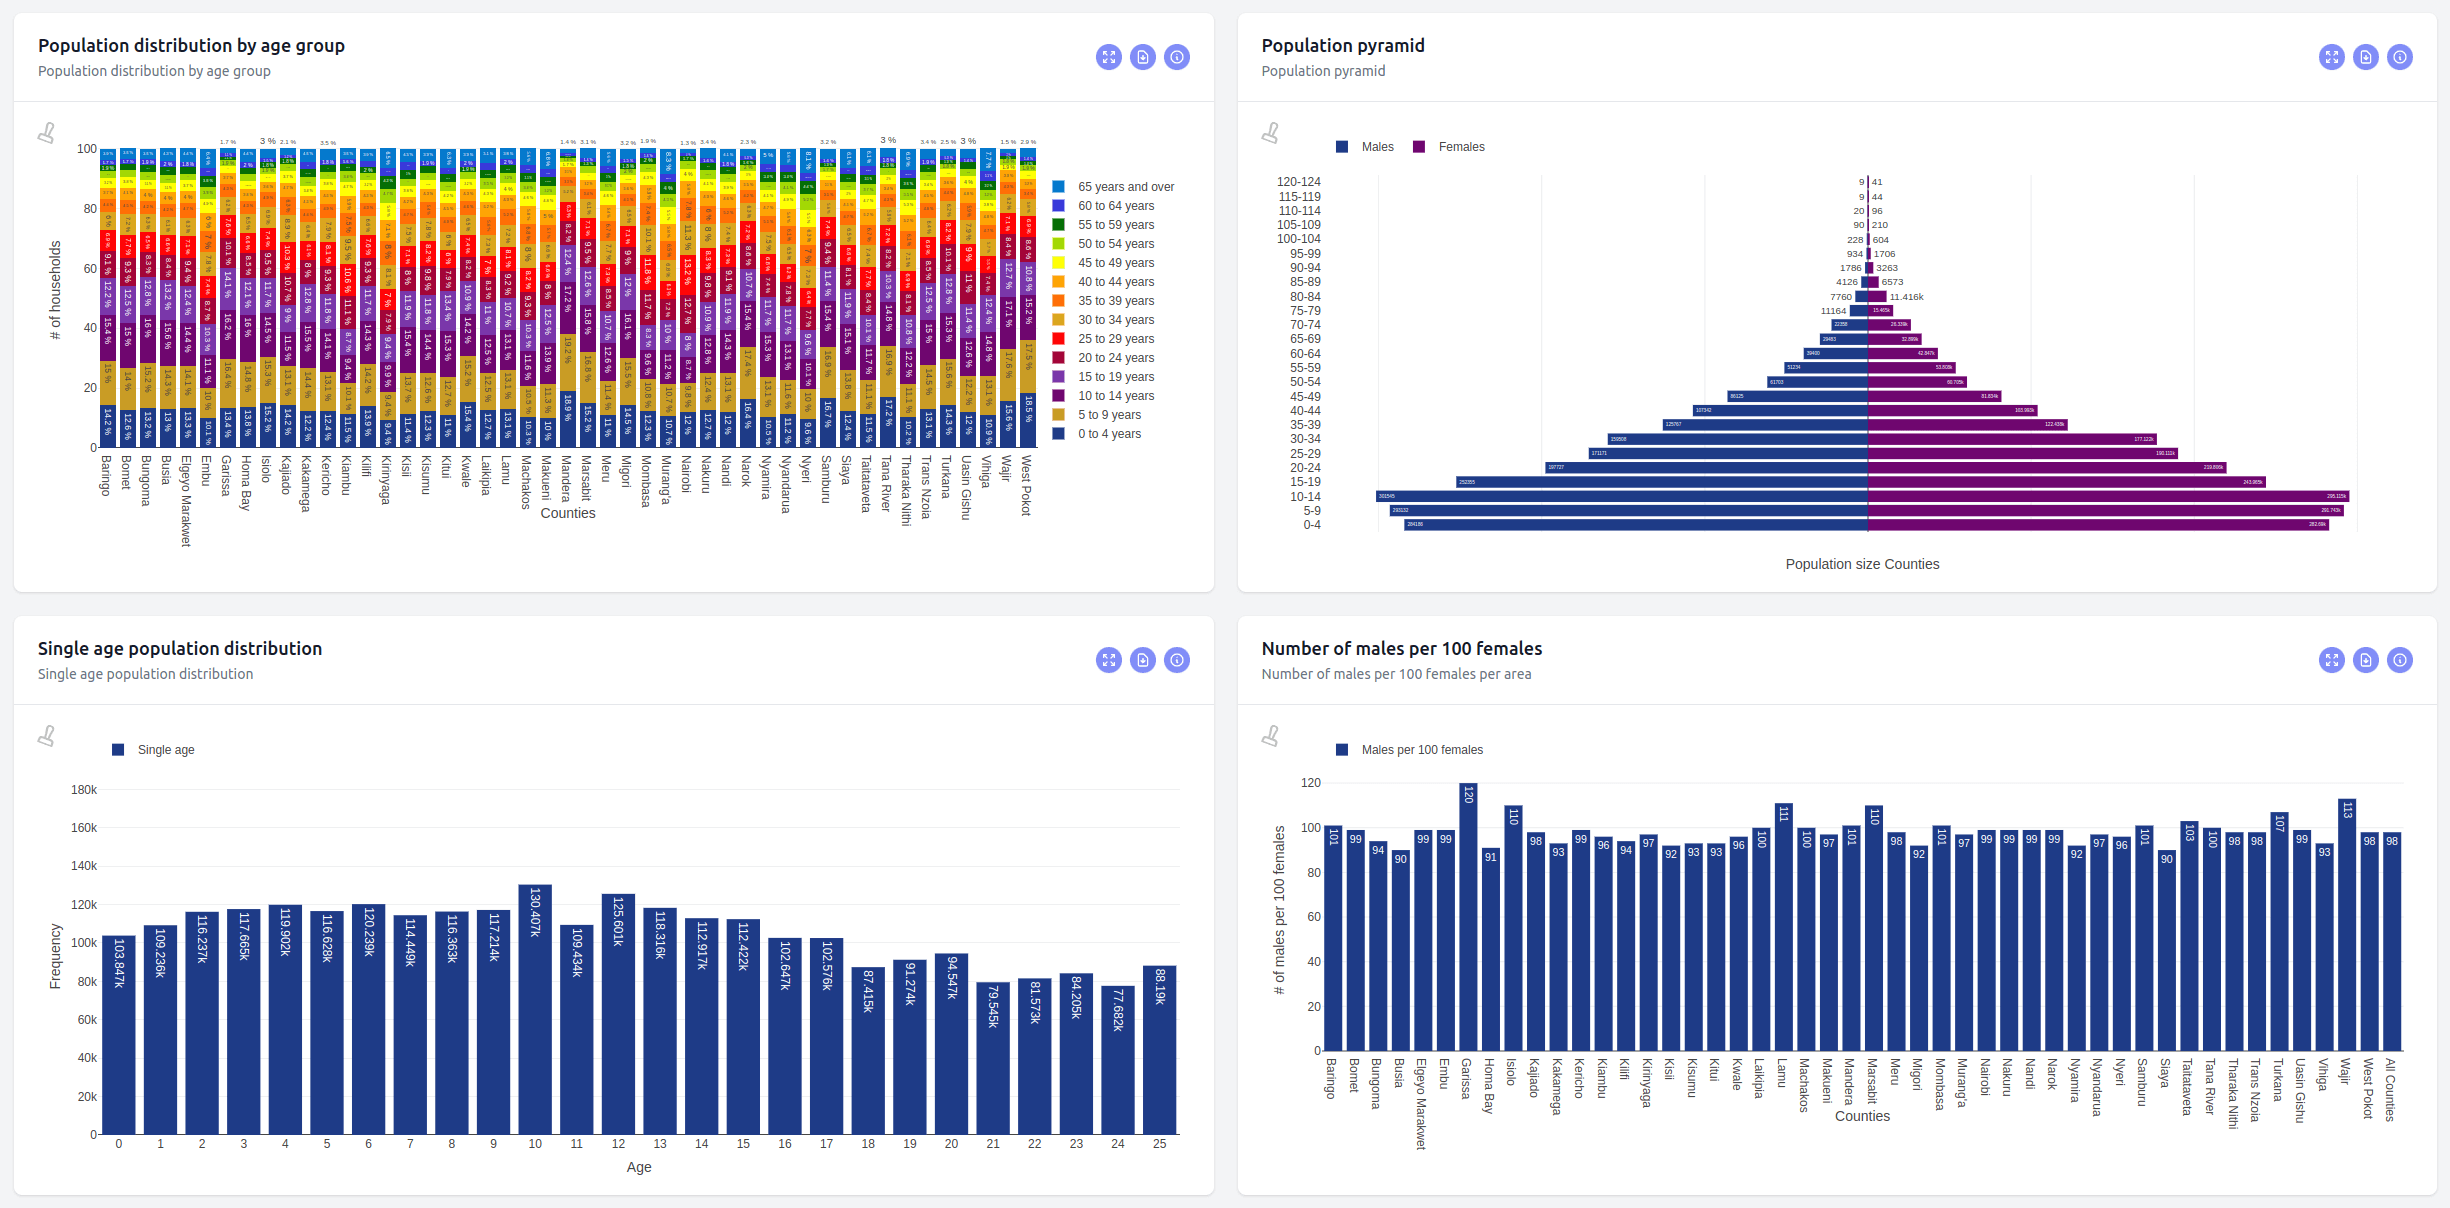
Indicators usually are data elements that represent statistical data for a specified time, place, and other characteristics. They are mostly depicted graphically in the form of common chart types such as bar, line, pie and others.
They also include metadata for the indicator such as a brief description, title and and extended text that is meant to aid in understanding what is depicted by the indicator.
Pages
A page is simply a grouping of indicators/reports/map-indicators into a single web page that is accessed via the top navigation bar. The same artefact can be present in multiple pages and users can be granted access to pages or even to individual artefact.
Map Indicators
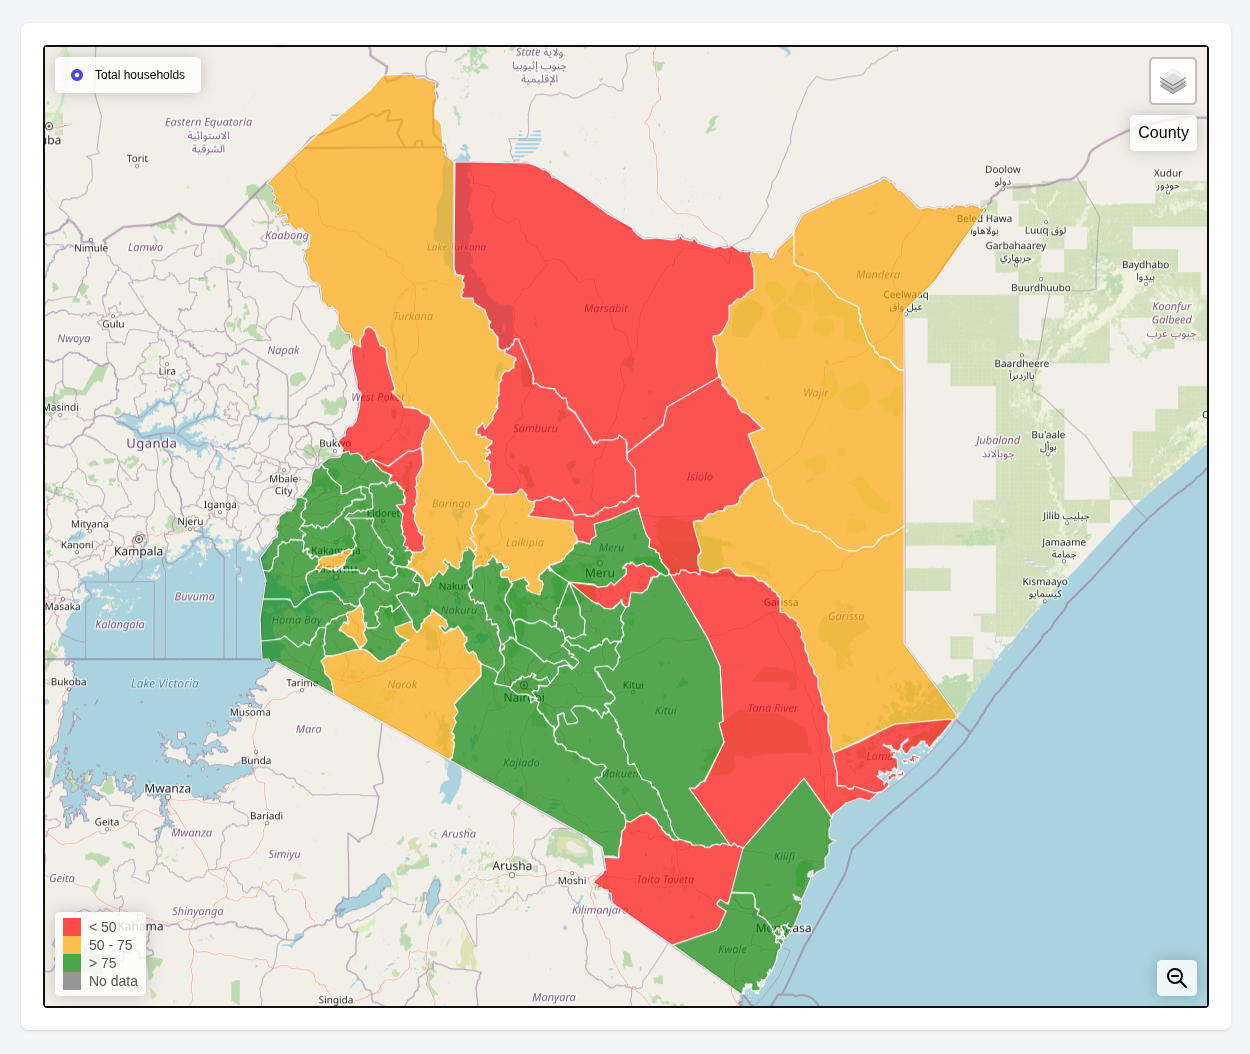
Map indicators are simply map based representations of indicators. Data is displayed on top of maps. Values can be shown by hovering on each boundary and the boundary fill color also indicates the bin into which the value falls.
A legend provides clarity for the data bins.
Reports
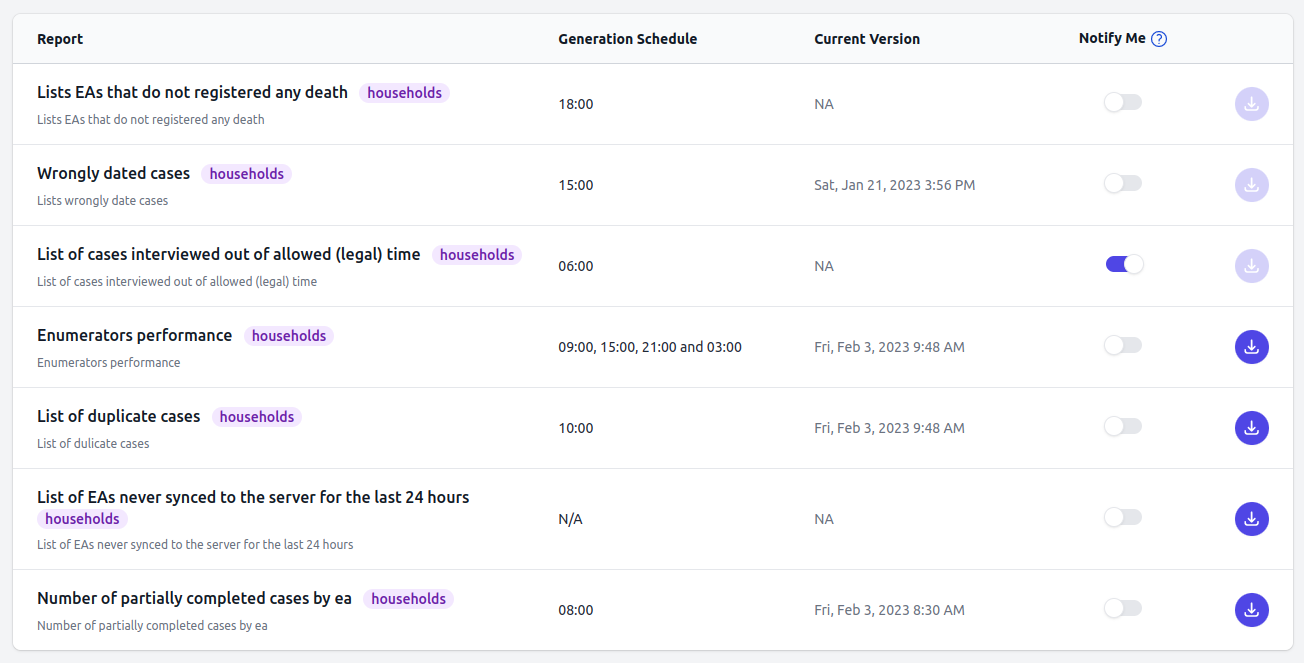
Reports are compiled tabular datasets presented as Excel file formats. They are automatically generated based on a set schedule and can also be automatically emailed to designated users of the dashboard.
Area Insights
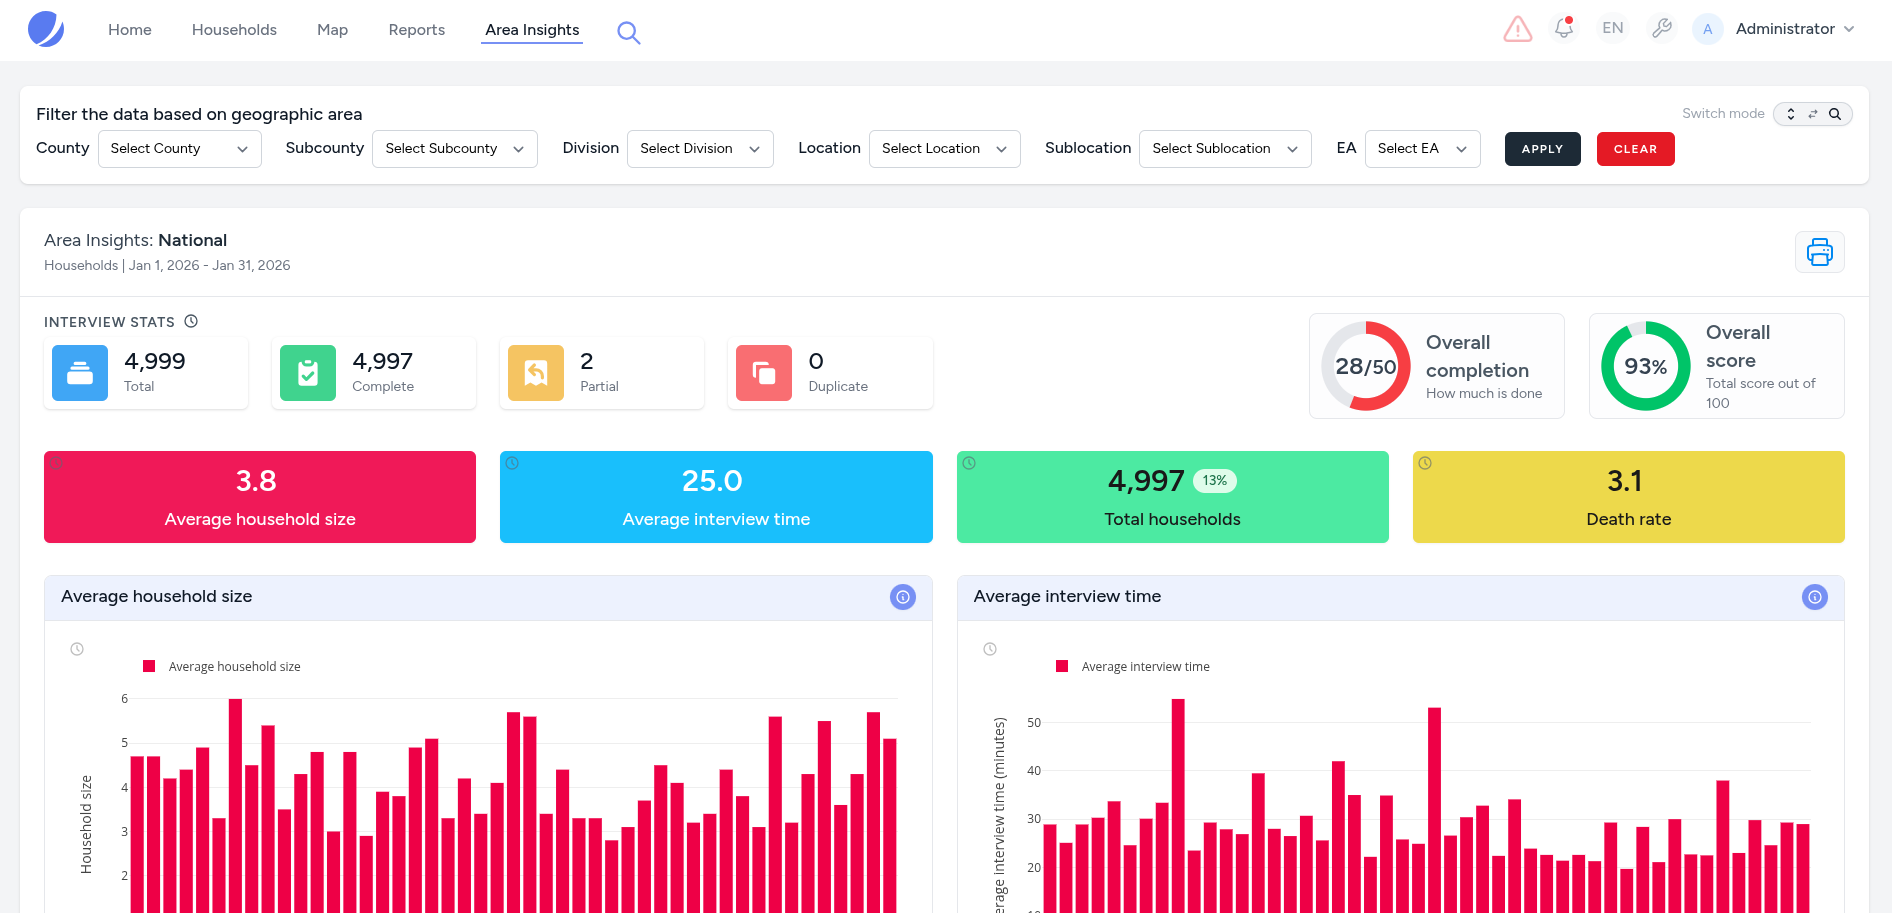
The Area Insights page is a dynamic, power tool designed to provide a comprehensive, yet highlevel snapshot of field operations and thematic indicators of geographic areas. It translates complex datasets into actionable intelligence through a combination of high-level grading gauges, scorecards and interactive visualizations.
Utilize the filter bar to narrow data from a National overview down to specific areas, even EAs! The revamped filter bar now supports both drill-down and direct search-and-set modes which stay insync.