Creating indicators
Now that you have your core configuration in place, you can start creating indicators. Indicator creation involves either running a chimera command (interactive) on the command line or using a web form and will result in the creation of a file (component class) and addition of entries in to the database for created indicators, including permissions.
The created indicator file will contain the basics of an indicator, and it extends the base Chart class but will still require you two write some PHP code to implement your indicator fully.
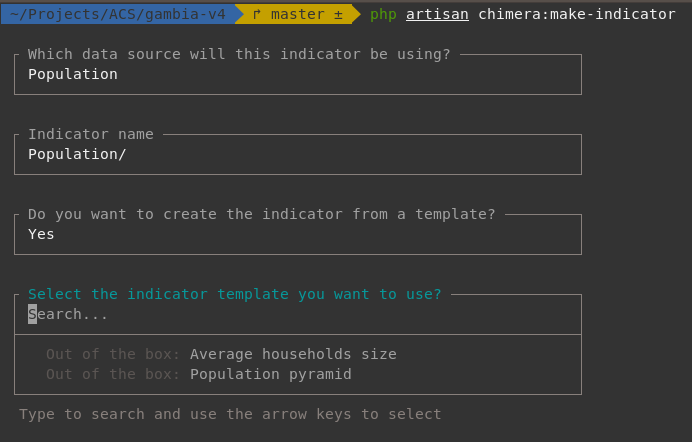
The first way is by running the php artisan chimera:make-indicator command and following the various prompts. This works best when you are running a linux machine.
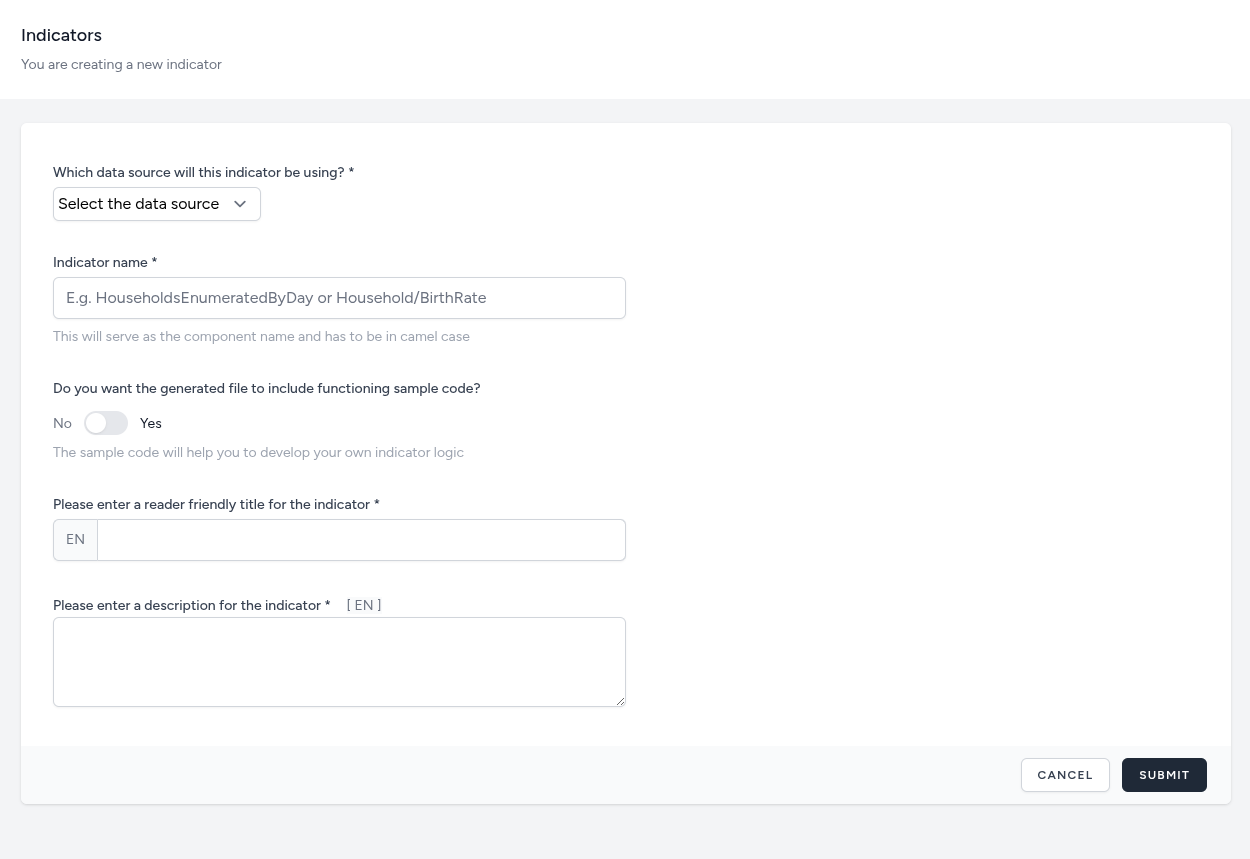
The second way is by going to the Manage dashboard menu and selecting Indicators, then pressing the CREATE NEW button and filling out the form as required.
Both methods allow you to control various aspects of the generated file.
You can choose to have some working sample code included in the generated file so that you can immediately start seeing realistic looking indicators in your dashboard.
You can also choose to use indicator templates that have already been partially built out by us (and hopefully other contributors or yourself using the chart builder tool we include).
WARNING
Please pay special attention when you provide a name for your indicator. It is what will became both the class and file name for you indicator and will create directories if you specify it. When creating, please read the prompts and hints very carefully.
For example, the following will result in the creation of a folder called Enumeration in the app/Livewire directory and a file named HouseholdsEnumerated.php inside the Enumeration directory.
Indicator templates
Indicator templates are partial implementations of common indicators such as population pyramid, household size, sex ratio, etc.
We will likely include 'out-of-the-box' indicator templates with every installation of the starter kit. You can also 'save as template' any of the indicators you create via the chart designer tool and all templates will be available for use when using the make-indicator command as can be seen in the screenshot above.
What indicator templates give you is the chart design. You still have to implement the getData() method, which is what fetches and returns the data from the database.
Designing the Chart
The Design button opens the chart editor, a visual workspace for configuring the indicator's Plotly traces and layout. The editor presents a split-pane interface: a schema-driven sidebar on the left and the Plotly canvas on the right.
The Design button is only visible when Developer Mode is enabled.
Visual Composition
The left-hand sidebar provides controls for managing the Traces (data series) within a chart:
- Trace Management: Add multiple traces to a single chart (e.g., separate traces for Males and Females).
- Trace Properties: For each trace, you can define:
- Type — Select the chart format (e.g., Bar, Scatter, Pie).
- Data Mapping — Assign specific data columns to the X and Y axes.
- Orientation — Toggle between Vertical and Horizontal layouts.
- Axes Assignment — Each trace can be mapped to specific X and Y axes, allowing for dual-axis charts or subplots.
Advanced Styling
Beyond basic data mapping, the interface offers:
- Structure & Subplots — Manage grid layout, margins, and spacing.
- Transforms — Apply real-time data transformations (e.g., filtering or sorting).
- Style — Customize color palettes, fonts, and marker shapes.
- Annotate — Add custom text, labels, or titles directly onto the plot area.
Workspace Controls
- Live Preview — The central canvas renders the chart in real-time as settings are adjusted.
- Data View — Toggle to the Data tab to inspect the raw numbers driving the visualization.
- Save as Template — Save the current configuration as a reusable template for creating related indicators.
- Save & Reset — Commit changes or revert to the previous state.
Indicator Templates
Indicator templates are partial implementations of common indicators such as population pyramid, household size, sex ratio, etc. You can save any indicator you design as a template via the chart editor. Templates are available when using the chimera:make-indicator command or the web form.
What indicator templates give you is the chart design. You still have to implement the getData() method yourself.
Example: Configuring a Stacked Bar Chart
After implementing getData() to return your query results, use the chart editor to:
- Add one trace per data series (e.g., three traces for age groups
< 15,15-64,65+). - Set each trace Type to
bar. - Map the X column to
area_nameand the Y column to the respective percentage column. - Rename each trace to its readable label using the Name field.
- In the Bar Layout section, set Mode (
barmode) tostackand Normalization (barnorm) topercent. - Click Save.
Deleting indicators
Deleting indicators (including permissions and database entry) can be accomplished by using the generic chimera:delete command
php artisan chimera:deleteEditing and publishing indicators
Editing and publishing indicators can be accomplished via the 'Manage' menu.
There, you can edit indicator titles, descriptions, contextual help text and also provide multilingual translations for applicable fields.
You can also add the indicator to one or more of the pages you have already created.
The default state of indicators when they are created on the command line is to be in 'draft' mode. You can publish them so that they can become visible on the pages they are added to by using the status toggle button.
If you choose to, you can also feature any indicator on the home page under its respective data source summary section. Featured indicators are indicated in the management list by a trophy icon.
Implementing generated indicators
There are two possible versions your generated indicator file might have.
- Empty
If you choose opt out of the inclusion of working sample code during the generation, you will end up with the following file.
<?php

namespace App\Livewire\Households;

use Uneca\Chimera\Livewire\Chart;
use Illuminate\Support\Collection;

class BirthRate extends Chart
{
    public function getData(string $filterPath): Collection
    {
        // TODO: Implement getData() method.
    }
}
If you publish it and see the results on the destination page, you will see an empty graph that displays a standard text stating the lack of data for the indicator.
- With sample code
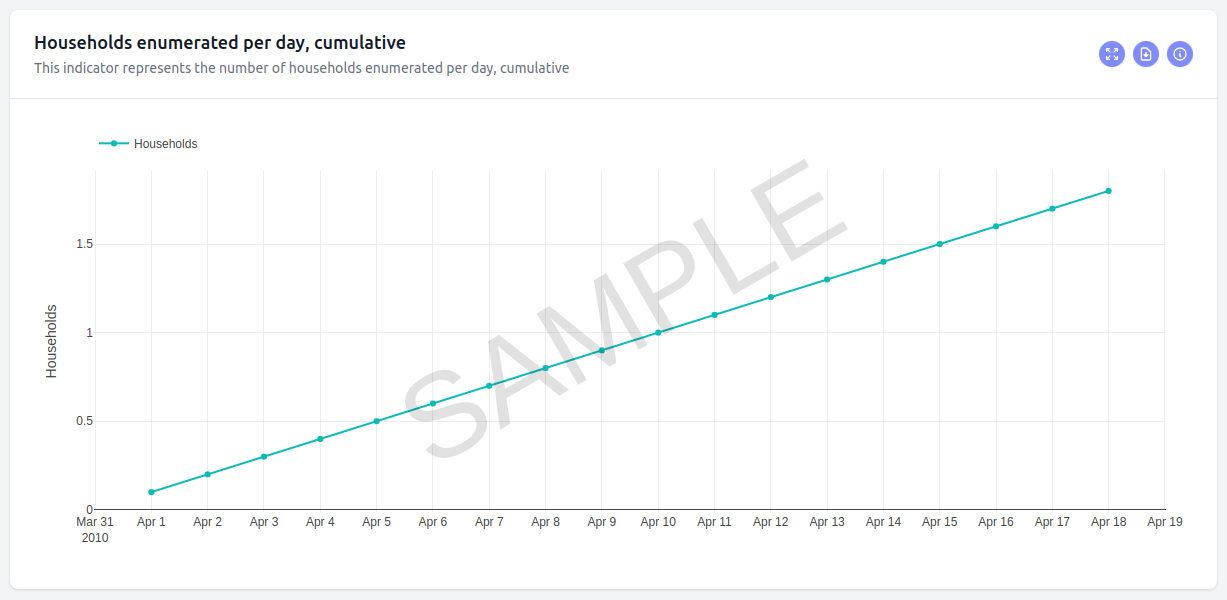
If you choose to include sample code during the generation of the indicator, the resulting file will have a fully implemented getData() methods inside the class.
If you previewed it, you would see something like the following
- From a template
If you select an existing template during the generation of the indicator, the resulting file will be identical to the first (empty) case but will have the provided chart design added to the indicator's entry in the database.
INFO
While the getData() method can be implemented in any way you want as long as you return a Laravel collection from it, you would be better served if you used the included BreakoutQueryBuilder class to do it. This powerful class provides various helpful methods such as:
- lastlyAreaLeftJoinData()
- lastlyAreaRightJoinData()
- debugLog()
- dump()
All of which along with the SQL like methods such as select(), from() etc. help you to craft and dispatch a query that will return the data you desire to see. The best way to learn about it is to read the code.