Creating gauges
Gauges provide a clear visualization of a single metric relative to a predefined goal or maximum value. Unlike standard bar charts, gauges focus on proportionality and achievement. In addition to the numeric representation, color scales are used to communicate status at a glance without requiring much cognitive effort.
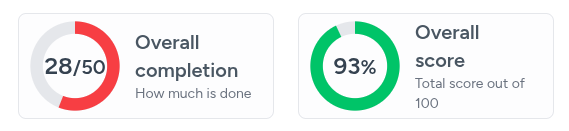
Creating Gauges
There are two ways to create gauges: a CLI command and a web form.
The first way is by running the php artisan chimera:make-gauge command and following the prompts. This works best on Linux/macOS/WSL environments.
The second way is by going to the Manage dashboard menu, selecting Gauges, then pressing the CREATE NEW button and filling out the form as required.
The gauge name must be in CamelCase (e.g., KenyaCensus/Progress). It becomes both the PHP class name and the file name, and will create subdirectories if you use forward slashes.
Gauges display three things: a title, a subtitle, and a value (with unit or reference). Both title and subtitle are required fields when creating a gauge.
Implementing Gauges
You will need to write code in your generated gauge file so that it queries and returns the values you intend.
You have flexibility in how you implement your gauge, as long as the getData() method returns a Laravel Collection containing an object with a key called value, which is the value to display.
The base class already provides sensible defaults for the display properties. You only need to override them if you want different behavior:
$this->outOf— The mathematical denominator. It defines the "perfect score" or the target/maximum value for the gauge. Default:100$this->unit— The display suffix shown in the center of the gauge. Default:'%'$this->colorThresholds— The semantic styling engine. Maps value thresholds to Tailwind CSS color classes to provide immediate status feedback. Default:[70 => 'text-red-500', 90 => 'text-amber-500', 101 => 'text-green-500']
The color assignment works by finding the first threshold where your value is less than or equal to the threshold. For example:
public array $colorThresholds = [50 => 'text-red-500', 70 => 'text-amber-500', 101 => 'text-green-500'];- A value of
42→ matches≤ 50→ red - A value of
65→ matches≤ 70→ amber - A value of
85→ matches≤ 101→ green - A value greater than all thresholds → gray
Editing and Publishing Gauges
After creating a gauge, you can edit it via the gauge management interface. The edit form includes:
- Title and Sub-title — Multilingual fields.
- Rank — Controls display order when multiple gauges appear together.
- Unsupported area levels — Hide the gauge at geographic levels where it would be irrelevant.
- Status — Toggle between Draft and Published.
Gauges only render on the Area Insights page. They do not appear on regular indicator pages or the home page.
Implementation Examples
Reference Value Gauge (Progress)
A gauge that compares a value against an external reference:
public array $colorThresholds = [50 => 'text-red-500', 70 => 'text-amber-500', 101 => 'text-green-500'];

public function getData(string $filterPath): Collection
{
    return (new BreakoutQueryBuilder($this->gauge->data_source, $filterPath))
        ->select(['COUNT(*) AS total_households'])
        ->from(['housing_rec'])
        ->groupBy(['area_code'])
        ->lastlyAreaLeftJoinData(referenceValueToInclude: 'number_of_hh')
        ->get()
        ->map(function ($item) {
            $item->value = Number::format(safeDivide($item->total_households, $item->ref_value) * 100, 1);
            return $item;
        });
}
This queries the total households per area, includes reference values via lastlyAreaLeftJoinData(), and calculates the percentage against the target.
Self-Referential Gauge (Ratio)
A gauge that computes its value entirely from its own data:
public array $colorThresholds = [10 => 'text-red-500', 30 => 'text-amber-500', 101 => 'text-green-500'];

public function getData(string $filterPath): Collection
{
    $result = (new BreakoutQueryBuilder($this->gauge->data_source, $filterPath))
        ->select([
            'COUNT(*) AS total_households',
            'SUM(CASE WHEN adequacy_index = 1 THEN 1 ELSE 0 END) AS adequacy_met',
        ])
        ->from(['housing_rec'])
        ->getSingleRow();
    return collect([(object)['value' => Number::format(safeDivide($result->adequacy_met, $result->total_households) * 100, 1)]]);
}
This introduces several patterns:
- Self-referential ratio — The value is computed as
adequacy_met / total_households × 100, both from the same data. No external reference needed. getSingleRow()— A convenience method that stripsGROUP BYand area-join post-processing, returning only the first row. Use this when you need a single aggregate value rather than per-area drill-down.SUM(CASE WHEN ...)pattern — Standard SQL for counting rows that satisfy a condition.- Low-prevalence thresholds — The thresholds are tuned to
[10, 30, 101]because the adequacy prevalence in the data is low.