Core configuration
Now that you have scaffolded a new dashboard, it is time to start filling it out with indicators and all the other things that make it a useful dashboard.
The first thing you need to put in place are your core settings and configurations.
These are:
- Data source setting
- Area hierarchy configuration
- Areas importation
- Reference values importation
Data sources/questionnaires
Your dashboard can connect to and work with multiple data sources (databases) and your census/survey does not need to be using CSPro. Our dashboard works with any kind of data in any kind of database as long as Laravel has a driver for it.
Out-of-the-box, we support MySQL, MariaDB, Microsoft SQL, PostgreSQL and SQLite databases as data sources.
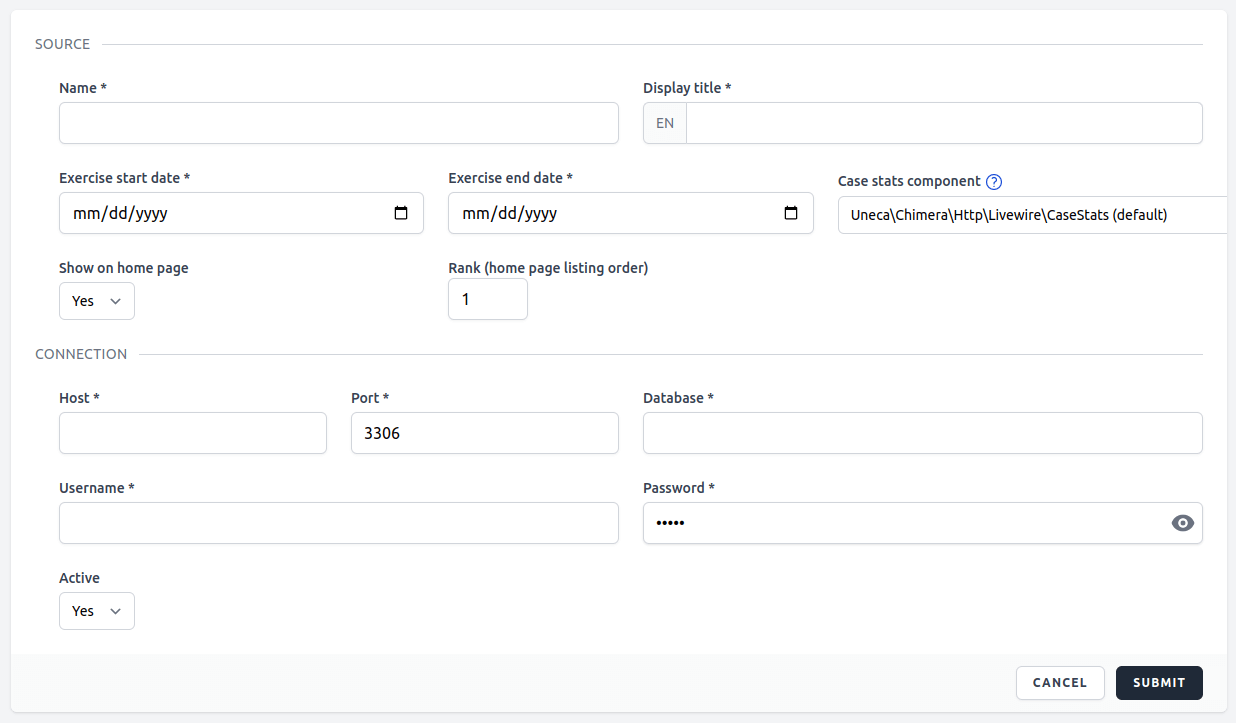
As you should already be logged in using a 'Manager/Super Admin' type account, you can directly head to the 'Management' menu (see screenshot below) in your dashboard and start adding data sources.

To create a data source, you need to provide two sets of information. The first one deals with the census/survey exercise and the second one pertains to the database where the respective data is stored.
To be able to set/apply the core configurations, you need to enable developer mode 🛠
Developer mode can only be enabled if you are logged in using a Super Admin account. To enable it, go to the user profile page and tap/click seven times in the small blank area just above the first horizontal divider.
Once enabled, it will stay so only for the current logged-in session and can also be manually disabled after you are done applying the desired core configurations.
However, when you environment is set to local in .env, developer mode will automatically be enabled.
Area hierarchy 🛠
What we refer to as area hierarchy is the administrative division (administrative unit, country subdivision, administrative region, subnational entity, etc.) you choose to employ in your census/survey exercise.
These are usually the mandate of one branch of the government and are either adopted as is or modified by National Statistical Offices (NSOs) to fit their particular need.
The common names for the principal (largest) administrative divisions are: states (i.e. "subnational states", rather than sovereign states), provinces, lands, oblasts, governorates, cantons, prefectures, counties, regions, departments, and emirates. These, in turn, are often subdivided into smaller administrative units known by names such as circuits, counties, comarcas, raions, județe, or districts, which are further subdivided into the municipalities, communes or communities constituting the smallest units of subdivision.
Source Wikipedia article: Administrative division
Go to the 'Area Hierarchy' menu item under the management dropdown menu.
You should see an 'Add' button as long as you are in development mode, otherwise, you will only see a list of area hierarchies you have already added or an empty table.
(You need to have developer mode enabled to be able to create your area hierarchy. If developer mode is not enabled, you will not see the 'Add' button.)
Please note that the order of appearance of the area entries is important. It signifies hierarchy.

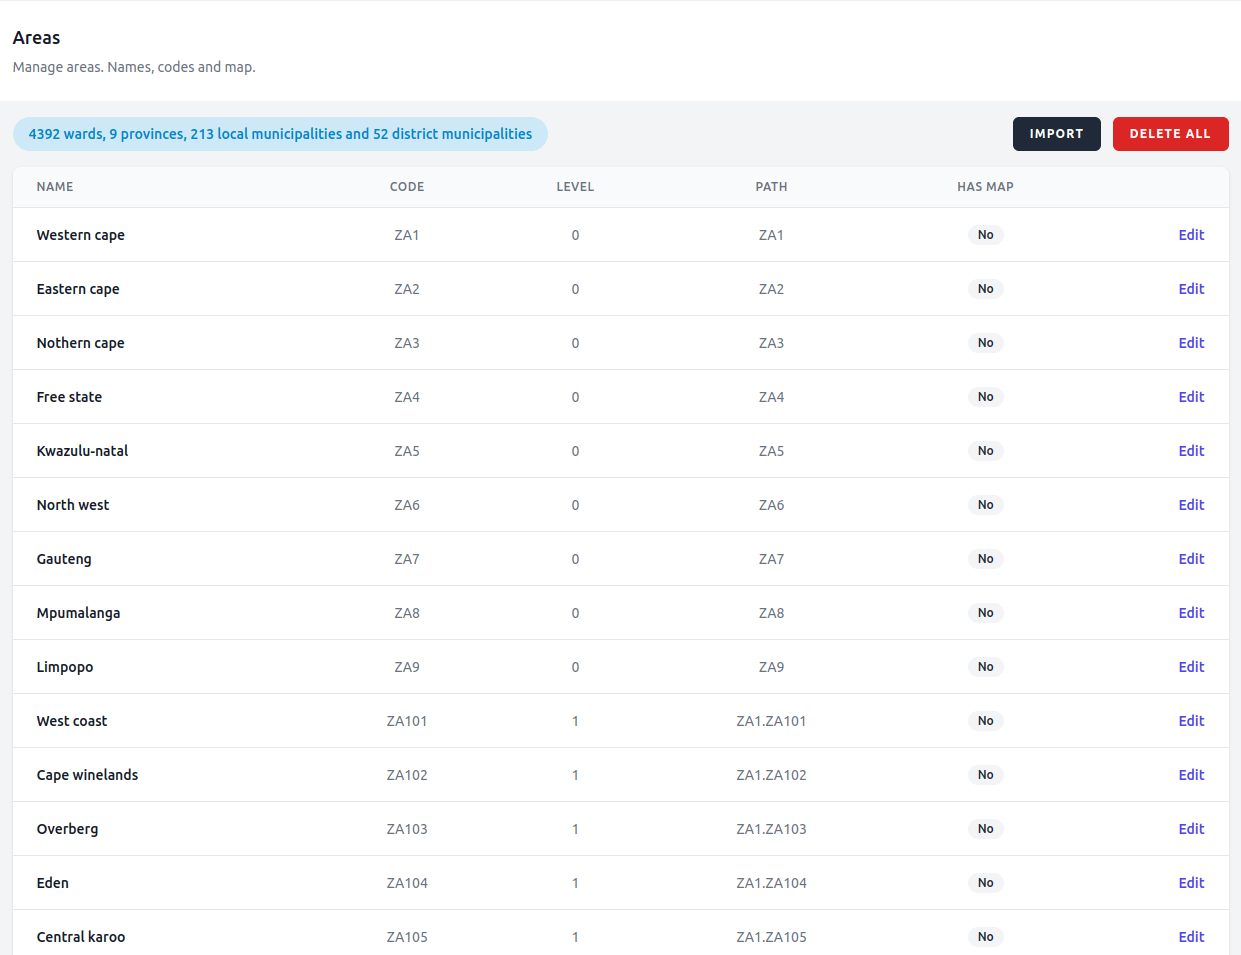
Area importation 🛠
Once you define your area hierarchy, the next step is to actually import your areas into the system so that it can be used for filtering various indicators, creating maps, etc.
You have the option of importing the data from two file formats:
-
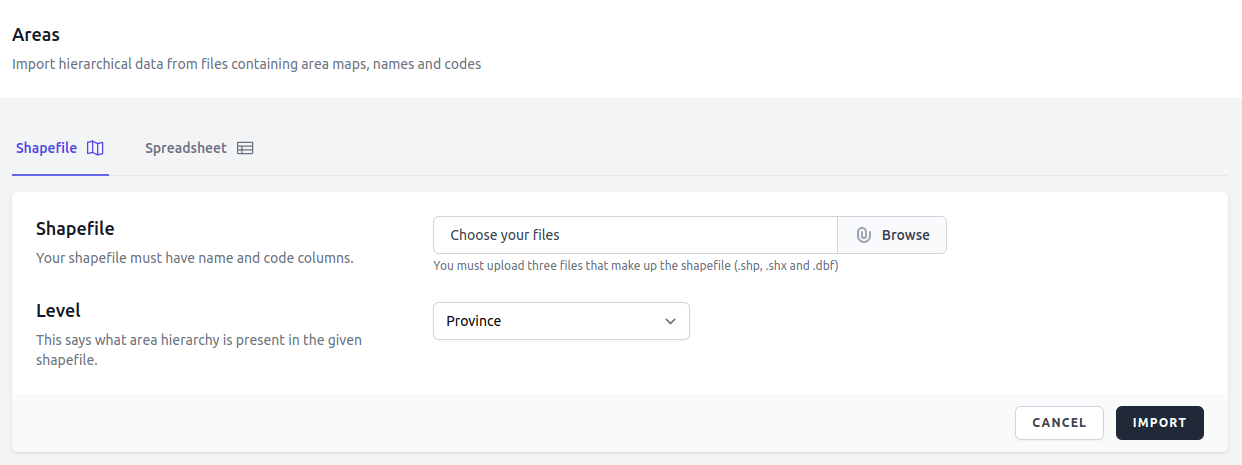
Shapefiles (preferred)
Shapefile (.shp, .shx and .dbf) is the preferred file format for importing areas into your dashboard because it contains both the spatial data and the area metadata (names and codes).
When importing the various levels via shapefiles, the dashboard will take care of associating them with each other (creates the parent-child relationship) by matching them spatially. Therefore, it is important to make sure that all your shapefiles are consistent and that they are spatially contained by one another.
The algorithm has a threshold of about 70% minimum containment that it uses to pair parent-child areas. If you choose to "simplify" you shapefiles, make sure that you do not over do it. You can overlay them to check that lower levels are still contained (at least 70%) by their immediate higher level area.
Please make sure that the shapefile you are attempting to import has the EPSG:4326 - WGS 84 Coordinate Reference System (CRS).
-
Spreadsheets (.csv)
You can also import your areas via a csv file but here you will not have the maps and therefore can not have map based indicators in you dashboard.
When importing, you can use the interface to map which columns of your spreadsheet hold which area level (name and code) and are also able to apply zero padding to your codes to match how they appear in your source data (questionnaire).
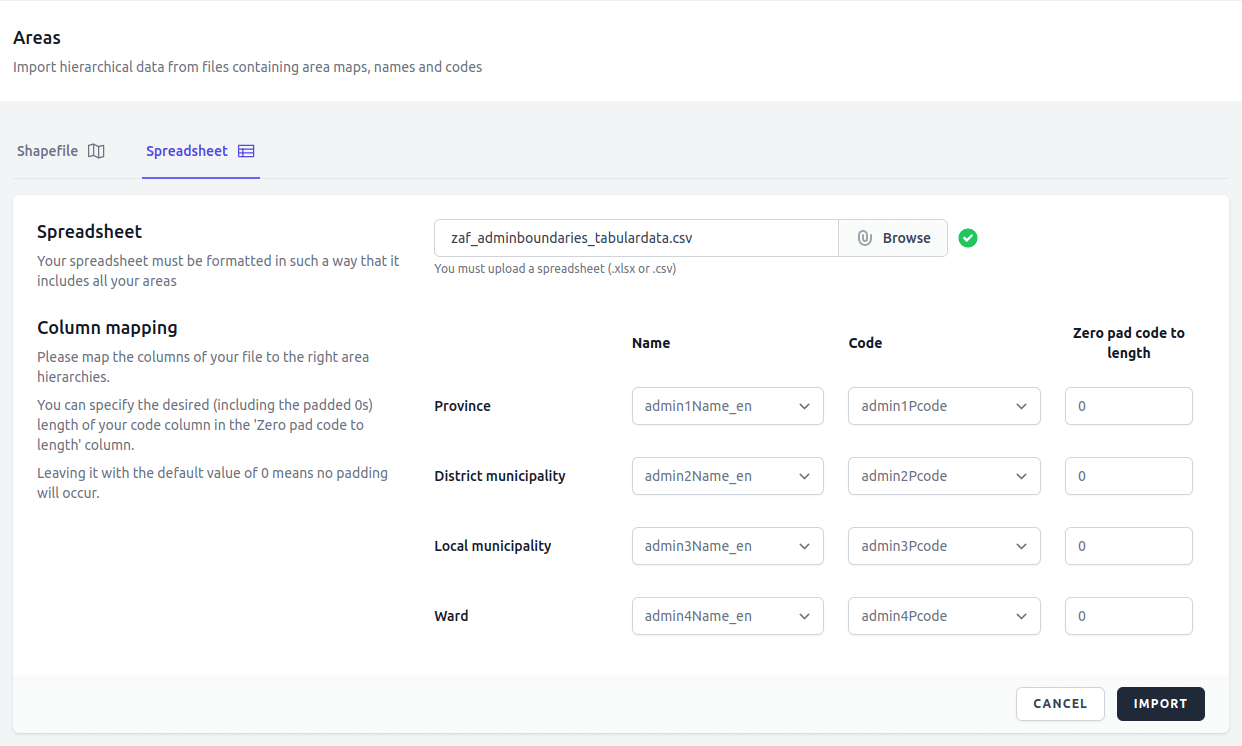
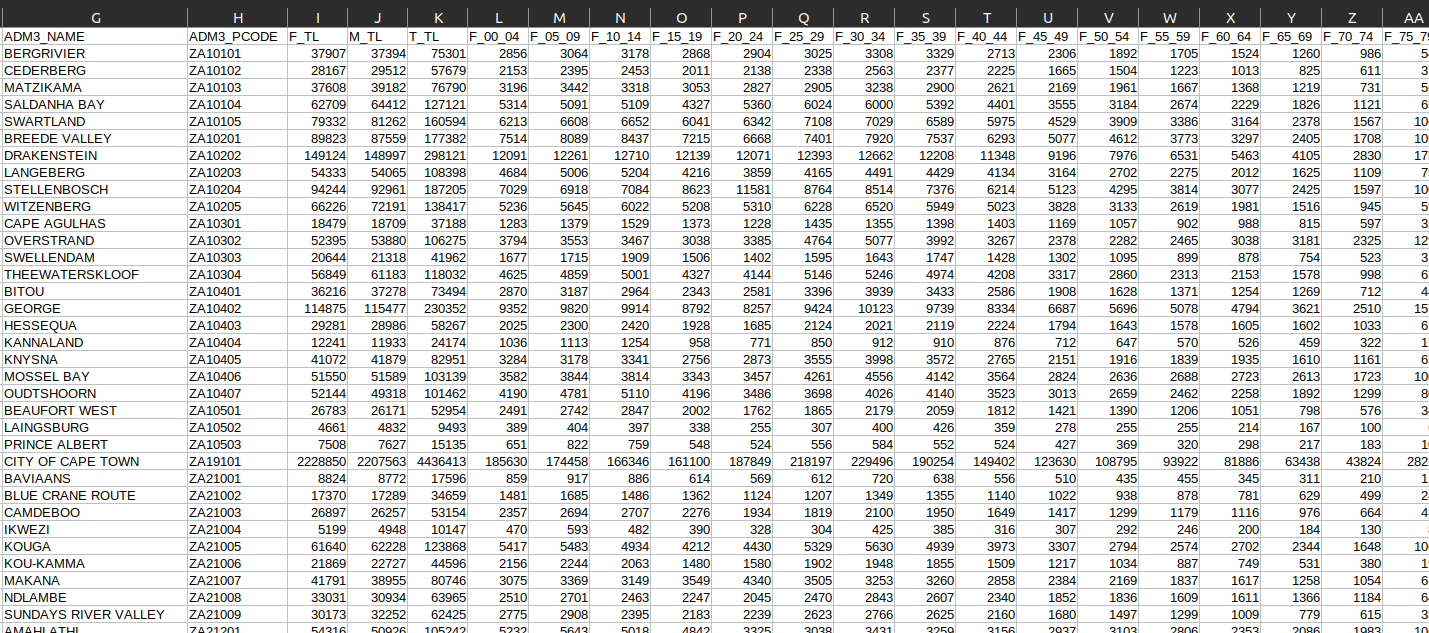
The imported data should look something like the following
The example spreadsheet data for South Africa, seen above, was sourced from The Humanitarian Data Exchange
When the process has completed, you will receive a notification. If the importation was successful, you will find the path column formula in the notification message, which you can use on the same spreadsheet file to generate a new "path" column which will be used to uniquely identify the areas and which is also required when you import reference values.
You must make sure that your area codes in the csv or shapefiles match your codes from the database. If they need zero padding, the csv importer can help you with that but you will have to apply the zero-padding to the shapefiles yourself. If they also need concatenation, make sure you take care of that before attempting to import them.
In case you have already imported your areas (EA Frame) via a csv file, you can then also import your shapefile to augment them with spatial data. Make sure the codes in the shapefiles match the ones you have already imported in the csv file.
When trying to import a file, if you get an error message stating that the file must not be of size greater than 12MB, then you can override this default file size limit in the livewire.php config file.
Just follow the instructions in the Laravel Livewire documentation here
Reference value importation 🛠
What we generally refer to as reference values are concepts such as 'expected values' and 'target values'. These are used for comparing your actual data against so that you have some frame of reference to better understand the data/indicator your are viewing.
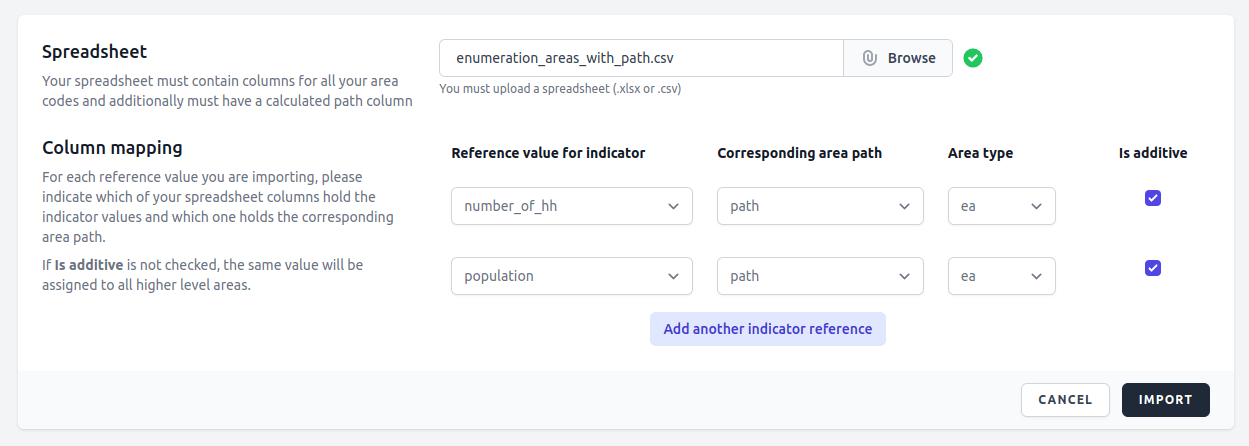
To import reference values, you will need to have the data in a CSV file and it needs to be at the lowest area hierarchy level (usually EA).
The file needs to have at least two columns. One for path (can be generated using the formula provided on the top of the form) of your lowest area hierarchy and another for the value of the reference value you are importing. It is common to have multiple columns, each named by the reference value they represent, in the same spreadsheet.
The following screenshot depicts how one would do mapping of columns to import reference values from the above CSV file.
You can see that the number of households (number_of_hh) and population are being imported here. Also note that since the data is at the last area hierarchy level, and as it is population data, the "Is additive" option has been selected and therefore the data will be summed and saved for the respective higher level areas. We are also selecting the column containing the paths we have generated after having imported the areas, in an earlier step. It is used to join the reference values with their respective areas.