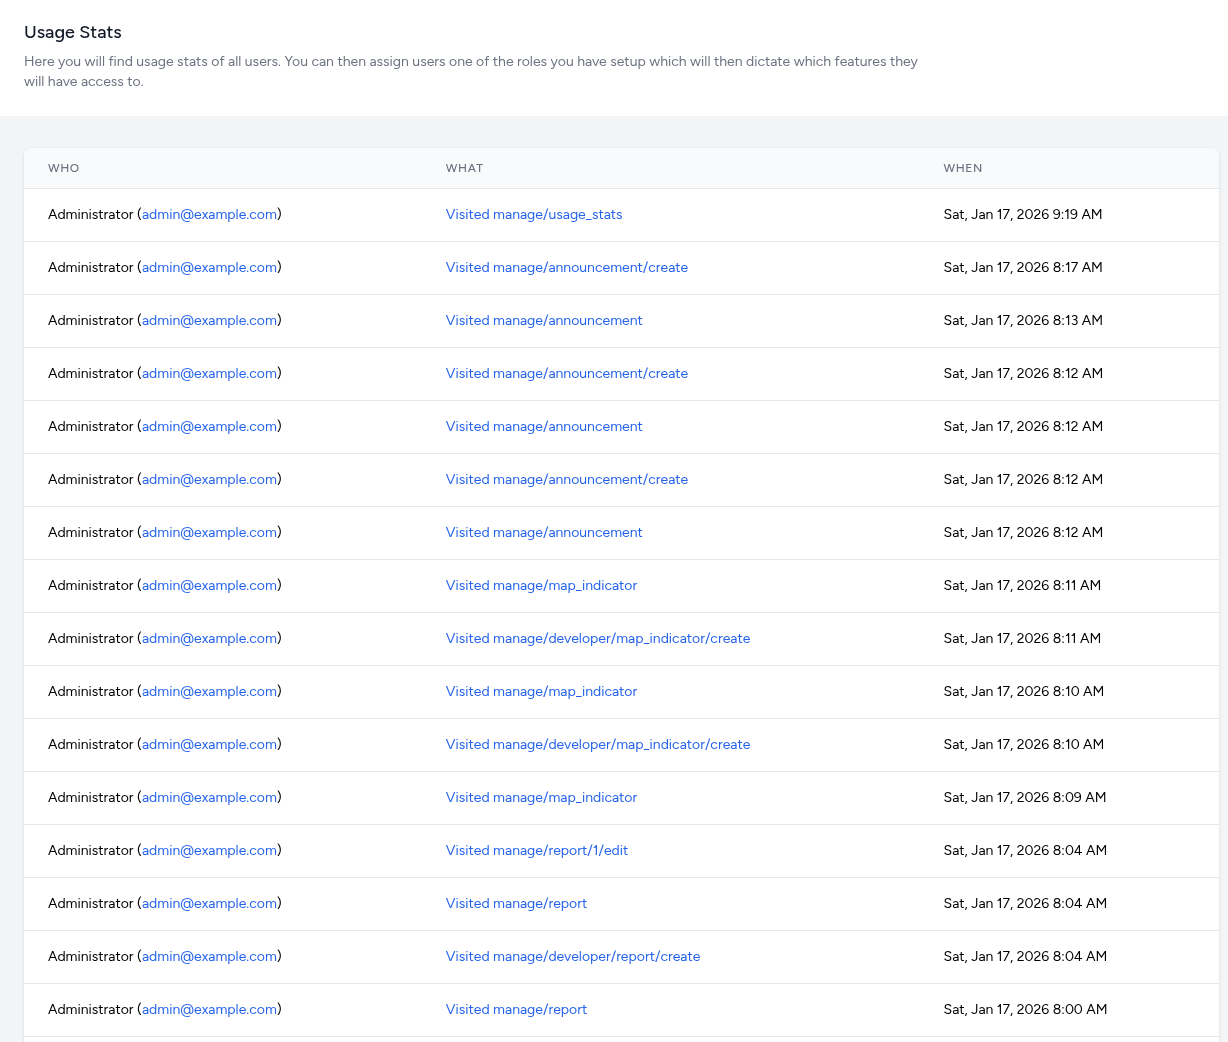
Usage stats
The Usage Stats module serves as a simplified telemetry and audit system. It captures a continuous stream of "visit" events, recording every instance a visitor navigates to a specific route within the dashboard's backend.
The interface organizes route-tracking data into three primary columns to provide a clear history of system navigation:
-
Who: Displays the role of the user (e.g., Administrator) and their unique email address in parentheses.
-
What: Records the specific URI or system route that was accessed. This allows for granular tracking of which tools are being utilized, such as:
-
When: Provides the full date and high-precision timestamp for the visit (e.g., Sat, Jan 17, 2026 8:12 AM).
Interactive Filtering in Usage Stats
The Usage Stats interface uses a dynamic "Click-to-Filter" system. Every blue link in the activity table acts as a shortcut to isolate and analyze specific parameters of the system's audit history.
Filtering by User (Who)
Clicking on an administrator’s Email Address (displayed in blue) immediately refines the list to show only the actions taken by that specific individual.
-
Use Case: If a configuration error is discovered, you can filter by that user to see their entire session history and understand the sequence of changes they made.
-
Security Audit: Quickly verify if a specific account is accessing routes it shouldn't be, or monitor the activity level of a new team member.
Filtering by Route (What)
Clicking on a specific System Path (e.g., manage/indicators or manage/report/edit) filters the log to show every time any user accessed that specific module.
-
Use Case: If a specific report is failing, filter by that report’s edit route to see who has modified it recently.
-
Feature Adoption: Track how often developers are using "Create" routes vs. "Edit" routes to gauge development velocity.
Breadcrumb & Clear Filters
Once a filter is applied, the interface typically displays a "breadcrumb" or "active filter" badge at the top of the table.
- Resetting: Look for a "Clear Filter"(x icon) to return to the full chronological log.